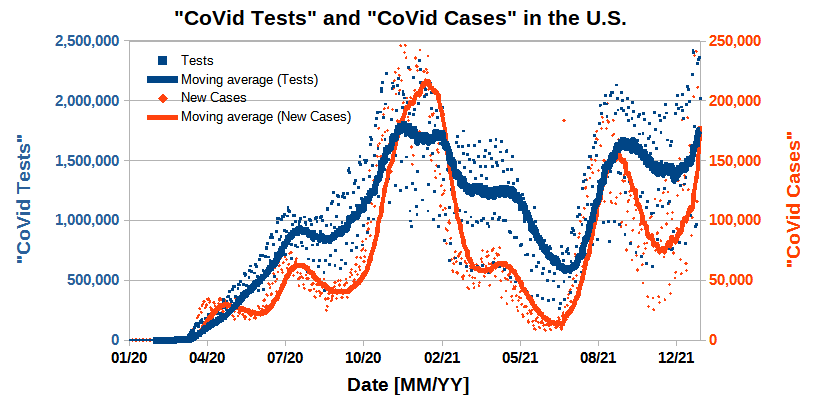
Figure 1 shows the “Offical Numbers” of “CoVid Tests” and “CoVid Cases” per day in the U.S. over a 2 year period. The solid lines are the 30 day running average.
Figure 1. “Official Numbers” of “CoVid Tests” and “CoVid Cases” per day in the U.S. The solid curves are the 30-day running-averages. There is a large amount of “noise” in these numbers that obscure the calculated Correlation.
What do your lying-eyes tell you? I “see” that when the “Testing” Rate goes up, so too do the number of “Cases”1. You want more “Cases”? Just dial-up the “Testing” knob.
The average of a 30-day-Correlation between “Tests” and “Cases” from 1/9/20 through 1/20/22 is 87%. Consequently, at least 76% of the variation in the number of “Cases” is due to the variation in the number of “Tests”.
The CoVid “Case” number is, to first order, is merely a reflection of the number of “Tests” performed.
How does one engineer a MSM-Hyped-Hysteria CoVid-1984 Mass-Psychosis Fear-Pandemic ?
First one needs to generate FEAR. That is how the herd is controlled.
This was done with all the “reporters” and “Authorities” breathlessly “reporting” every day “New Cases”. The cases were generated using a PCR test, which when run with enough cycles, could get positive results from used motor oil or a piece of fruit.
In my next post I will look at “CoVid Deaths”.
I’d like to be able to correct the “Case Numbers” by modifying the “Test Numbers” with the Cycle Numbers used in the PCR Tests. I’m sure that this would improve the Correlation, but I don’t have these Data.


The PCR test has all along been the foundational fraud of the Plandemonium. Take any other given year not within the nonsensical Coronamania period and deploy a generally very non-specific gene assay empanelled test lab process, rig the positivity differential, overclock the sample reproduction and you would manufacture the same curves.
Even in the absence of any pathogen, novel or otherwise.
#themediaisthevirus
The official narrative