

There are DATA and there are Numbers
And then there are Complete Nonsense Numbers

DATA (the results of careful measurements) are often expressed as Numbers. But MOST Numbers are not DATA. People (especially the Mainstream Media) often confuse Numbers with Data. For example, let’s look at some Numbers regarding the Flu. The “Flu” Season begins at the beginning for the U.S. Fiscal Year, or the last Saturday in September and officially lasts for 6 months, so we are now halfway through the Flu Season (I just call it the Death Season – all over the world, northern or southern hemisphere, more people die in the Winter [when the are shut in and more socially distanced, and not getting much fresh air or sunshine and Vitamin D]). The CDC (Center for Disease Control) keeps tab of “Flu Deaths”, and indeed they are pretty fuzzy numbers, hardly what I would call good hard DATA. For example, in the 2019 “Flu Season” the CDC numbers are: 39 – 56 Million “Cases” and 24,000 – 62,000 “Flu Deaths”. That is quite a range for something the CDC has been tracking for decades (see Figure 1).

Now, for a bit of Cognitive Dissonance: Whereas the CDC can only make rough estimates of the Number of Flu Deaths each year, beginning in March 2019 we now know EXACTLY the official number of CoVid-1984 Deaths each day for not only every state in the U.S., but for every country in the world, and this Official Number is published at midnight each day, and never changes, and is recited breathlessly by reporters 10 times a day as though it were real DATA and not a made up Number, or a Number from a Model. It is clearly not DATA (a number coming from Measurements).
Figure 2 shows an example of some real DATA. This also comes from the CDC, and it is their counting of Death Certificates. It takes several months for this number to settle to within about 1% of its final value.
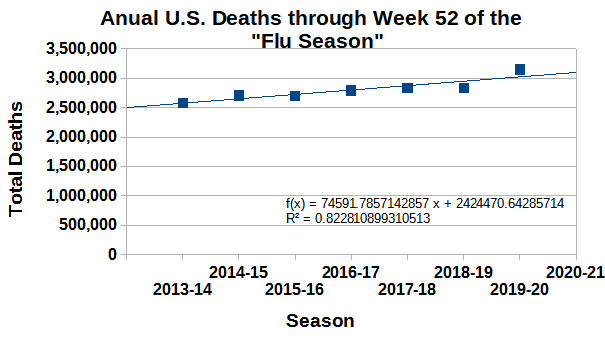
Figure 2. Totals Deaths per Year in the U.S. for the past 7 years during. This is actual DATA (the counting of Death Certificates by the CDC). The DATA don’t seem to show any “Pandemic” for the 2019-2020 Season. The number of deaths in the 2019-2020 Flu Season is above the line for the expected number of deaths by about the same amount as the number of deaths in the 2018-2019 season was below the line. There were a lot of old people that didn’t die in 2018-2019, but then did die in 2019-2020, and the Lock-Downs have certainly caused an increase in deaths. If one wanted to argue that there was a Pandemic in 2019-2020, they would also have to argue that there was an anti-pandemic in 2018-2019 – and that might be more useful to study and talk about.
So, the Number of CoVid-1984 deaths we hear each day is certainly NOT DATA – it takes months to count all the death certificates to get a good number, and then there is the problem with what exactly is a CoVid-1984 death. Apparently any death within 28 days (including the time of death) using a PCR test which has a false positive rate of 90 – 97%, and according to the CDC, only 6% of these deaths list CoVid-1984 as the sole cause of death; the other 94% have an average of 2.8 other co-morbidities. So, the Official Number of CoVid-1984 deaths is a completely meaningless number … but, as with the fraudulent number of “cases”, this made up number is being used, very successfully, to scare most of the population into compliance with Totalitarian Lock-Downs, Mask-Wearing, and Vaccination. And, this is just a made-up number, not at all real DATA.
Other Hopeful Signs of Civil Disobedience:
https://off-guardian.org/2021/01/15/i-am-open-50000-italian-restaurant-owners-plan-to-ignore-lockdown/
The article goes on to say how this movement has spread to Mexico and other countries in Europe. When in the Land of the Free and the Home of the Brave ?