USA #1 !
Sometimes Official "Numbers" are more interesting than real DATA
Let look at some “Official Numbers”. Below are official “numbers” from the Gates-funded John Hopkins School of Medicine:
Figure 1. “Official Numbers” from the Gates-Funded John Hopkins University School of Medicine Coronavirus Resource Center. This plot shows deaths purported to CoVid per 100,000 for all the countries in the world. You can pull it up here: https://coronavirus.jhu.edu/data/mortality
And if you pull up this plot, and let your cursor hover over the highest number of deaths per capita, you will find that point corresponds to the U.S. (341/100,000).
USA #1!
Yup, the “Official Numbers” show that the USA is #1 in both the number of CoVid Cases and the number of CoVid Deaths per capita! And this is in spite of the USA being #1 in another metric as well: we spent (transferred to some people) 4.6 Trillion dollars on that MSM Hyped-Hysteria CoVid-1984 Mass Psychosis Fear Pandemic. How much money is that?
$14,000 per U.S. citizen
$46,000 per U.S. taxpayer
Over 4 Million dollars for every purported CoVid Death, perhaps 40 Million per CoVid Death without 5 other co-morbidities
Almost 70% of the U.S. 2022 Federal Expenditures, and over 90% of the U.S. 2022 Revenue
If the rest of the world spent similarly per capita, transferring wealth to the few at the expense of the many, the world would have had to spend over 110 Trillion Dollars: 1.5 times the entire world’s GDP.
And, guess what? No one is in jail for this, and there hasn’t been a revolution!
How was this achieved, besides the obvious (e.g. financial incentives to label any death as a CoVid-death and the use of the invalid PCR test)? It’s an example of what is called “5th Generation Warfare”: some people just demonstrated to the world that without the use of a military, but rather the use of the Propaganda and Censorship Industrial Complex, i.e., “Information” Control, they make a good portion of the world do some really stupid things! Like walk around wearing scientifically-proven-ineffectual masks (some still do!), take multiple untested unproven injections out of fear (some still are), and let some people rob them blind. I could write a Science Fiction Story with this as the plot-line, but no one would publish it or read it: they would say it’s just too ludicrous, they wouldn’t be able to suspend their disbelief.
I wonder, just what will they have us believe and do next? (Stay tuned [or NOT] to CNN, MSNBC, NPR, and the President).
Oh, and here are some real DATA — deaths per week in the U.S. for the past 10 years.
Figure 2. Deaths per week in the U.S. for the past 10 years.
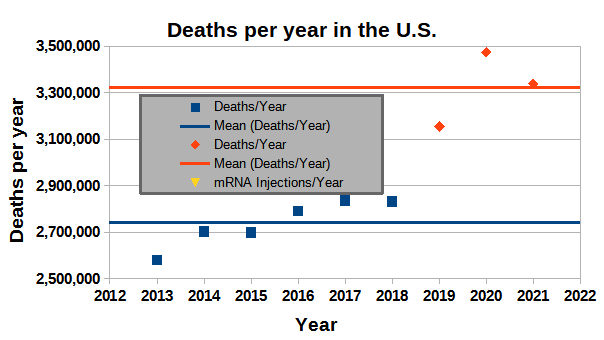
Figure 3 shows a summary of that DATA — with the U.S. averaging about a half million excess deaths per year, the new normal, about an 18% increase. Think we’ll ever go back to the old normal? Perhaps if we spend some MORE money ??? Perhaps if we give out MORE free injections?
Figure 3. Deaths per year in the U.S.; the old normal and the new normal.
Yep, USA #1 (also in the decrease in life expectancy):
Figure 4. U.S. #1 in decreasing life expectancy.


Dr. Ellison, I have read a couple of your posts, through CITIZENFREEPRESS.COM. I appreciate your observations a bringing them to public attention. You have misread the Johns Hopkins graph on Case Fatality Ratio/ Deaths per 100,000 population. Ignoring North Korea, China, and Yemen as very unreliable, Peru has the highest deaths/100,000 at 665/100,000 and USA is 14th at 341. Your conclusions about $ per patient being wildly high and effectiveness per $ being wildly low, are correct of course. I agree the net result of our entire pandemic effort has been a huge transfer of wealth to a few and no apparent benefit to public health.
Love what you're doing with your blog, Tim!