You Don't Want to Look at This
The DATA are there for anyone to see
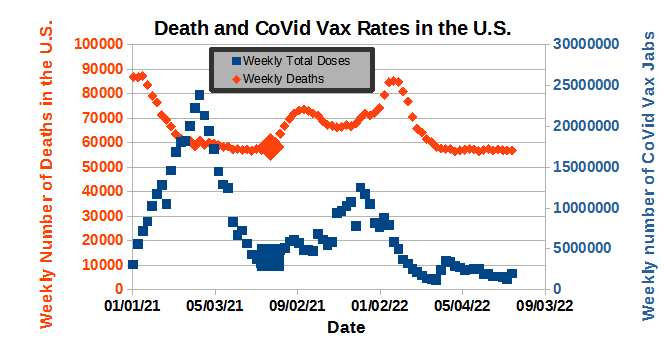
Figure 1 below shows the number of CoVid Vax’s1 and all Deaths2 per week in the U.S. using data from the CDC.
Figure 1. CDC Data showing weekly Vaccination Doses and Deaths.
At about 7/24/2021 (the date shown by the Super-Large data points in Fig. 1) I conjecture that CoVid had run its course, and the initial wave of Vaccinations had been completed (n.b. [note well]: the vaccinations began after all the dying had ended).
In a statistical analysis, I found zero-correlation between Vax-Rate and Death-Rate for this entire period. I’ve posted before about the zero correlation between Vax’s and CoVid “numbers”3.
For fun I looked at the (Correlation)^2, or the R-Squared Value, between the CoVid Vaccination Rate and Death Rate in the U.S. for the period beginning 7/24/2021 to the present as a function of the delay between Weekly Doses and Weekly Deaths. The results of this analysis are shown below in Figure 2.
Figure 2. R-Squared4 value for the correlation between Vax Rate and Death Rate in the U.S. for the period 7/24/21 to 7/16/22 as a function of delay between being Vax’d and dying.
Brief Discussion
The Vax’s are killing people.
Over 75% of the variation in the Death Rate can be explained by variations in the Vax Rate.
The peak in deaths occur about 7 weeks after being Vax’d, so probably don’t show up in the VAERS system.
There is a second peak about 20 weeks after the first peak — this is the CDC-recommend time to wait for a “Booster”.
I just did this analysis about an hour ago. I wanted to keep this posting Short and Simple. I’ll probably do a number of follow-ups, but I don’t want to SPAM your In-Boxes, and I still haven’t un-packed from my recent trip to VA, and still have a ramp to build.
Data from https://covid.cdc.gov/covid-data-tracker/#vaccination-trends
Data from https://gis.cdc.gov/grasp/fluview/mortality.html
I purposely use the word “numbers”, rather than the word “DATA”.
I discussed the meaning of the R-Squared value in


Acknowledgement:
A number of articles going around saying there is a 5 month delay between Vaxing and Dying.
That is not true.
But I wouldn't have done my work if I had not seen those articles and looked for myself.
So, I owe all my investigative work to your erroneous hypothesis, which I tested.
Thank you.
Plain and Simple in English:
Variations in the death rate have an 87% correlation (76% R-Squared value) to the vax rate, but lag the Vax's by about 7 weeks.
CoVid Vax's account for 76% of the variations in our country's death rate.