

More on the Gaussian
Can you say, "Desperate for ANY Data" ???

I previously wrote a Post about how There Ain’t any Data Anymore (just [made-up] numbers). I got desperate enough for some Real DATA to play with that I started counting the number day lilies off my front porch every day [11 June through 10 July ‘22]. I’ve started this task in past years, and hypothesized that the number vs. time might be described by a Gaussian, but I never got a full data-set: partway though the experiment, Nashoba (my wolf), would go and make a nest in the middle of the lilies and ruin my experiment. Wolves have been shot for much less than impeding the progress of important science, but I have always somehow restrained myself, because he was just so damm cute1. This year, being wolf-less, was my year!
The Gaussian Function is shown below:
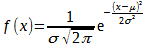
where “mu” is Mean and “sigma” is the Standard Deviation2.
My Day Lilly DATA and fits to both a Gaussian (R-squared=92%) and Poisson (R-squared=84%) distributions are shown below in Figure 1.

Figure 1: Number of Day Lilies vs. Day Number with fits to Gaussian and Poisson Distributions.
Now, you, perhaps not a highly-trained scientist, might say, “that’s not too bad of a fit!”,
But I would say, “I’ve seen better”.
For a truly amazing fit of DATA to a Gaussian, just look at Figure 2 below.

Figure 2. Histogram of Century-to-Century changes in the Earth’s Average Temperature over the last thousand Centuries that I created using the Vostok Ice-Core DATA. The Horizontal Axis is how much the average Earth’s Temperature changed from one century to the next; the Vertical Axis is how many times changes of that size occurred. The Orange-Red line is a Gaussian fit to the Histogram. The big purple square is the change in the average Earth’s Temperature over the last Century ending 2020.
For these DATA I get an R-squared of over 98%.
This tells me that there are apparently random changes in the Earth’s Temperature, Century-to-Century, with a Standard Deviation of 1.2 C. During the last century, the average Earth’s Temperature has changed by a mere 0.17 C, or 0.14 Standard Deviations which is Like-So-Really-Completely-Actually-Totally-Absolutely-Gag-me-with-a-Spoon statistically insignificant. Consequently, as I’ve previously discussed, anyone (e.g. Gore, Greta or NPR) telling you that we are seeing unprecedented large changes in the Earth’s temperature this century either hasn’t looked at the DATA, or is lying to you (or, perhaps, is just caught up in the Group-Think and sincerely believes this Dogma in the Follow-the-Science Religion).
And, just to get really serious, this Posting is clearly another Serious Data Point supporting the Hypothesis that these Silly Shutdowns are driving people insane.
Nashoba. Admit it. He was damm handsome, taking after his human companion, as canines often do.
Sorry, I don’t know how to do Greek Symbols in this Substack Editor — this editor must drive physicists mad. I made the equation using open-source LibreOffice Writer and pasted it in as a graphic, what a pain.
Understanding Figure 2.
Figure 2 is a Gaussian, or Normal distribution which describes the probability of something occurring when there is Randomness. The deviation will be less than:
+/- 1 Standard Deviation 68% of the time;
+/- 2 Standard Deviations 95% of the time; and
+/- 3 Standard Deviations 99.7% of the time.
In the past, we have seen changes in temperature over a century of over 3 Standard Deviations.
The change in Temperature over the last century has been relatively small -- only 0.14 Standard Deviations. There is only an 11% chance is seeing such a SMALL deviation in temperature over a century. So, the Earth's temperature, presently, is remarkably stable; 89% of the time we would expect to see larger changes in the Earth's temperature.
Wow, Dr. T, really like this post. Few things I have read are this short and this convincing! Call me a denier but the conclusion is most inconvenient. I look at your Lily data and I see a Beta distribution. Was unable to paste in a picture but upon going here:
https://www.medcalc.org/manual/beta-distribution-functions.php
I had limited success getting a shape that fit as well as I had hoped. Perhaps you tried already?
I am a big Latex user and have wondered about using substack as an author. May I conclude from your comment that is a no go, that to use substack you must use its editor which is equation unfriendly? Thanks